Home >>STATISTICS, Section 1, dispersion 2
first principles |
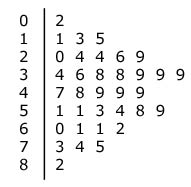
Stem & Leaf Tables/Diagrams
Stem & leaf tables are similar to bar charts but differ in two distinct ways:
1. The pattern is horizontal not vertical.
2. The display is made from numbers, not block colour.
The data is placed in number order within groups of ten. It is then displayed horizontally for each tens grouping, starting with zero (0-9) at the top.
The numbers are displayed in groups of 10's.
Each group of ten is given a single number: 0, 1, 2, 3, 4 etc.
where,
0-9 is group 0, 10-19 is group 1, 20-29 is group 2 etc.
0 (0-9) 2
1 (10-19) 11 13 15
2 (20_29) 20 24 24 26 29
3 (30-39) 34 36 38 38 39 39 39
4 (40-49) 47 48 49 49 49
5 (50-59) 51 51 53 54 58 59
6 (60-69) 60 61 61 62
7 (70-79) 73 74 75
8 (80-89) 82
Cumulative Frequency
Frequency is used to describe the number of times results occur.
On the other hand, cumulative frequency is a 'running total'. It is the sum of frequencies moving through the data.
Example - A survey was done to look at how many TV's there were in a household.
no. of TV's |
frequency |
cumulative frequency |
|
0 |
4 |
4 |
4 |
1 |
15 |
4+15 |
19 |
2 |
18 |
4+15+18 |
37 |
3 |
7 |
4+15+18+7 |
44 |
4 |
2 |
4+15+18+7+2 |
46 |
The definition of the median is that particular value half way through the data.
If the cumulative total of frequencies is 46, then the median is the 23 rd. value.
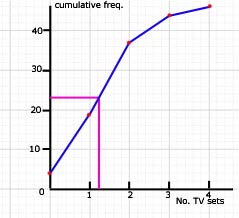
So the median, that is the value(tv sets) half way through the data(cumulative freq.), is 1 rounded to the nearest whole number.
Where there are lots of values(>10) the data is best presented as 'grouped data'.
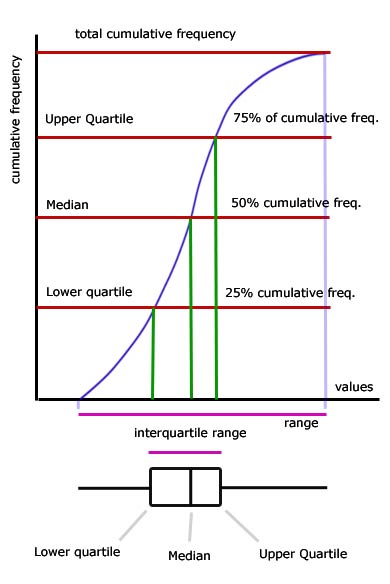
Percentiles
In general terms a percentile is a value related to hundredths of the cumulative frequency.
For example, the 73 rd percentile is the value 73 hundreds through the cumulative frequency.
Quartiles are values related to positions at quarters through the cumulative frequency.
The upper quartile is the particular value 3/4 through the cumulative frequency.
The lower quartile is the particular value 1/4 through the cumulative frequency.
In the example given above:
upper quartile = 0.75 x 46 = 34.5 (rounded to 36) - this gives a value close to 2
lower quartile = 0.25 x 46 = 11.5 (rounded to 12) - this gives a value close to zero
note: values are the readings along the bottom of a cumulative frequency graph
The interquartile range is the difference between the lower and upper quartiles.
interquartile range = 34.5 - 11.5 = 23
The interquartile range is a measure of how spread out data is.
With reference to products( eg the shelf-life of foods), a small value for the interquartile range means a more accurate result.
Box & Whisker Plots
The plot is derived from a cumulative frequency graph and shows the range of data , the interquartile range, and where the quartiles are in relation to the median.
[ About ] [ FAQ ] [ Links ] [ Terms & Conditions ] [ Privacy ] [ Site Map ] [ Contact ]