Home >>STATISTICS, Section 1, probability 2
first principles |
Independent Events ('AND' rule)
These are events/outcomes that are independent of each other.
This means that one has no effect on the other (eg rolling two dice).
The 'AND' rule is used to relate the probability of two independent events occuring.
If P(M) is the probability of an event M happening and P(N) for an event N.
Then the probability of both events occuring at the same time is given by:
![]()
Example #1
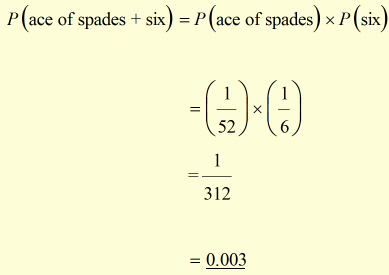
John picks a card at random from a pack of 52 cards and throws a dice.
What is the probability that he will pick the ace of spades and throw a six?
Independent events can be tabulated against eachother in a possibility space table.
Example #2
There are two spinners, one with four different colours and the other with the first five letters of the alphabet.
If both are spun independently, the table below shows all the possible outcomes.
1 |
2 |
3 |
4 |
5 |
|
red |
1,red |
2,red |
3,red |
4,red |
5,red |
green |
1,green |
2,green |
3,green |
4,green |
5,green |
blue |
1,blue |
2,blue |
3,blue |
4,blue |
5,blue |
orange |
1,orange |
2,orange |
3,orange |
4,orange |
5,orange |
yellow |
1,yellow |
2,yellow |
3,yellow |
4,yellow |
5,yellow |
There are 5 x 5 (=25) possible outcomes.
The chances on getting blue and a number more than 3 are shown in blue.
In other words, 2 chances in 25 (ie 0.08)
This can be verified using the 'AND' rule.
probability of getting blue is P(blue) = 0.2
probability of getting a number > 3 is 2/5 (0.4)
probability of both events happening is 0.2 x 0.4 = 0.08 |
Mutually Exclusive events or Incompatible Events ('OR' rule)
Events are said to be mutually exclusive if they cannot happen at the same time.
The 'OR' rule is used to relate the probability of one independent event happening OR another independent event happening at the same time.
The probability of event M OR another event N, when the two are mutually exclusive, occuring is given by:
![]()
Example
A bag contains 10 coloured balls : 3 blue balls, 2 green balls and 5 red balls.
If one ball is removed from the bag, what is the probability of getting a red ball or a blue ball?
answer:
P(blue or red) = P(blue) + P(red)
= 3/10 + 5/10
= 8/10 = 0.8 |
When one ball is removed from the bag, the probability of getting a red ball or a blue ball is 0.8
Tree Diagrams
A tree diagram is a way of visualising a probability problem.
method:
1. Show the event/question above each branch group.
2. Write the probabilities of the event/question close to each branch.
3. Write the outcome of each event/question at the end of each branch.
4. The sum of the probabilities on each branch add up to 1.
Example
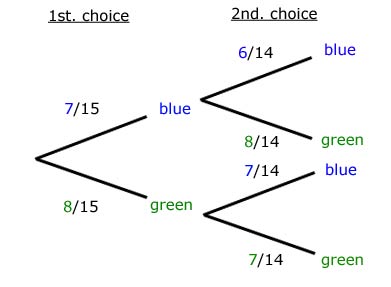
A black bag contains 15 marbles. 7 of the marbles are blue while the remainder(8) are green.
One marble is chosen from the bag. Then another is chosen, without the first marble being returned.
i)
|
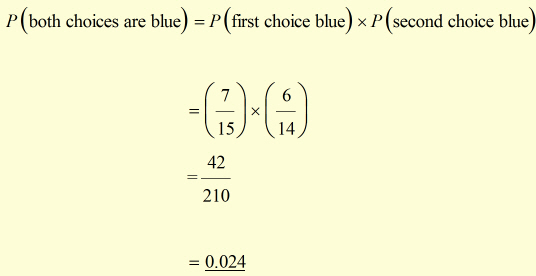
What is the probability that both choices are blue? |
ii)
|
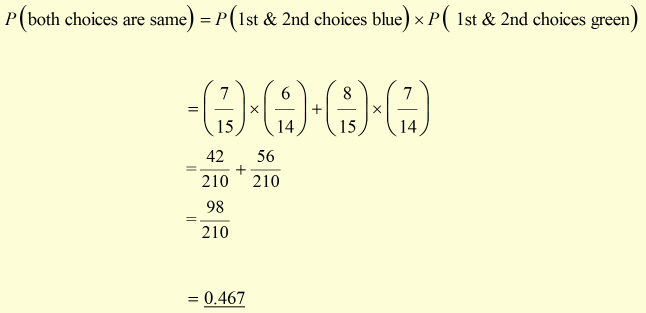
What is the probability of choosing two marbles of the same colour(in any order)? |
iii)
|
What is the probability of choosing two marbles of different colours(in any order)? |
i)
ii)
iii)
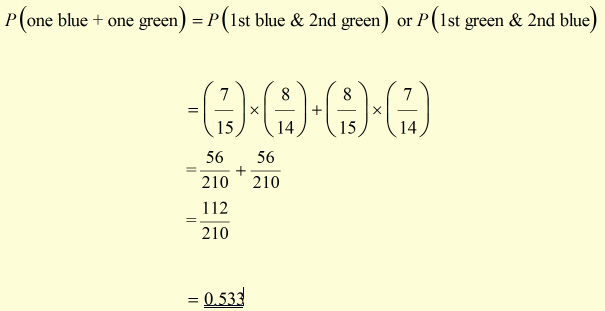
note: probability of same colour + probability of different colour = 1
[ About ] [ FAQ ] [ Links ] [ Terms & Conditions ] [ Privacy ] [ Site Map ] [ Contact ]